Documentation made easier
kvm_stat − Report KVM kernel module event counters
kvm_stat [OPTION]...
kvm_stat prints counts of KVM kernel module trace events. These events signify state transitions such as guest mode entry and exit.
This tool is useful for observing guest behavior from the host perspective. Often conclusions about performance or buggy behavior can be drawn from the output. While running in regular mode, use any of the keys listed in section Interactive Commands below. Use batch and logging modes for scripting purposes.
The set of KVM kernel module trace events may be specific to the kernel version or architecture. It is best to check the KVM kernel module source code for the meaning of events.
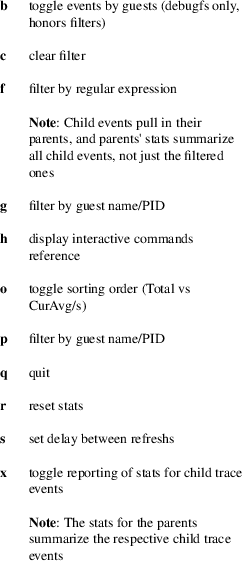
Press any other key to refresh statistics immediately.
−1, −−once, −−batch
run in batch mode for one second
−c, −−csv
log in csv format. Requires option −l/−−log or −L/−−log−to−file. When used with option −L/−−log−to−file, the header is only ever written to start of file to preserve the format.
−d, −−debugfs
retrieve statistics from debugfs
−f<fields>, −−fields=<fields>
fields to display (regex), "−f help" for a list of available events
−g<guest>, −−guest=<guest_name>
limit statistics to one virtual machine (guest name)
−h, −−help
show help message
−i, −−debugfs−include−past
include all available data on past events for debugfs
−l, −−log
run in logging mode (like vmstat)
−L<file>, −−log−to−file=<file>
like −l/−−log, but logging to a file. Appends to existing files.
−p<pid>, −−pid=<pid>
limit statistics to one virtual machine (pid)
−s, −−set−delay
set delay between refreshs (value range: 0.1−25.5 secs)
−t, −−tracepoints
retrieve statistics from tracepoints
−z, −−skip−zero−records
omit records with all zeros in logging mode
perf(1), trace−cmd(1)
Stefan Hajnoczi <stefanha@redhat.com>